
Try it right here
This loads the live project from its own domain, exactly as a visitor would see it.
What it does
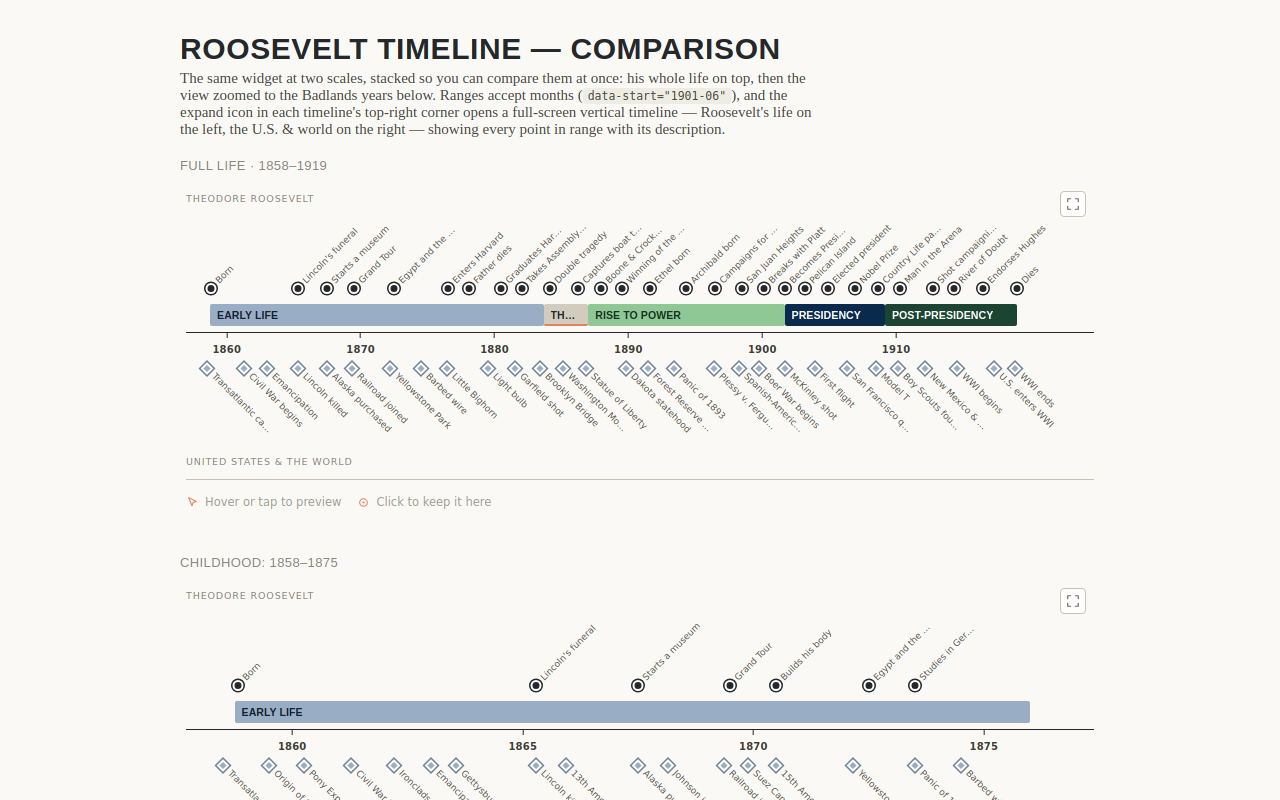
Roosevelt's milestones run above a central date axis; American and world events run below it. A visitor reading about the Badlands years sees, in the same glance, that the Statue of Liberty went up while he was there.
The embed code sets the window, so one file serves a full-life view or a tight six-year slice. Every date, label, and blurb lives in one plain data file — editing the timeline means editing data, never code. An expand icon opens a full-screen vertical version showing every point.
What it can do
- Date-driven windows via
data-startanddata-end— year, month, or exact day - Named presets: full, earlylife, badlands, risetopower, presidency, postpresidency
- Weight-based label density that re-fits itself on resize
- Hover or tap for exact dates; click to pin an event in the readout
- Full-screen vertical timeline with chapter dividers
- Optional Explore buttons linking any point to a page on your own site
Make it your own
Start by forking the repository into your own organization. Everything below assumes you are working in your fork, not this one.
- Fork the repo. The whole widget is three files:
tr-timeline.js,tr-data.js, andindex.html. - Rewrite
tr-data.js. It holds three lists —phases(chapter bars),events(your subject's milestones), andhistory(context events). Each entry takes a year, an optional exact date, a label, a weight from 1 to 5, and a blurb. - Swap the fonts and palette referenced in
tr-timeline.jsfor your own, keeping the safe fallbacks. - Replace
CNAMEwith your domain, or delete it to use the default*.github.ioaddress. The deploy workflow publishes on every push tomain. - Embed with
<div data-tr-timeline data-start="1858" data-end="1919"></div>and one script tag. The widget finds its data file on its own.
Stuck on a step? Open an issue on the repository. Questions from people adapting these for their own institution are the most useful feedback we get.