
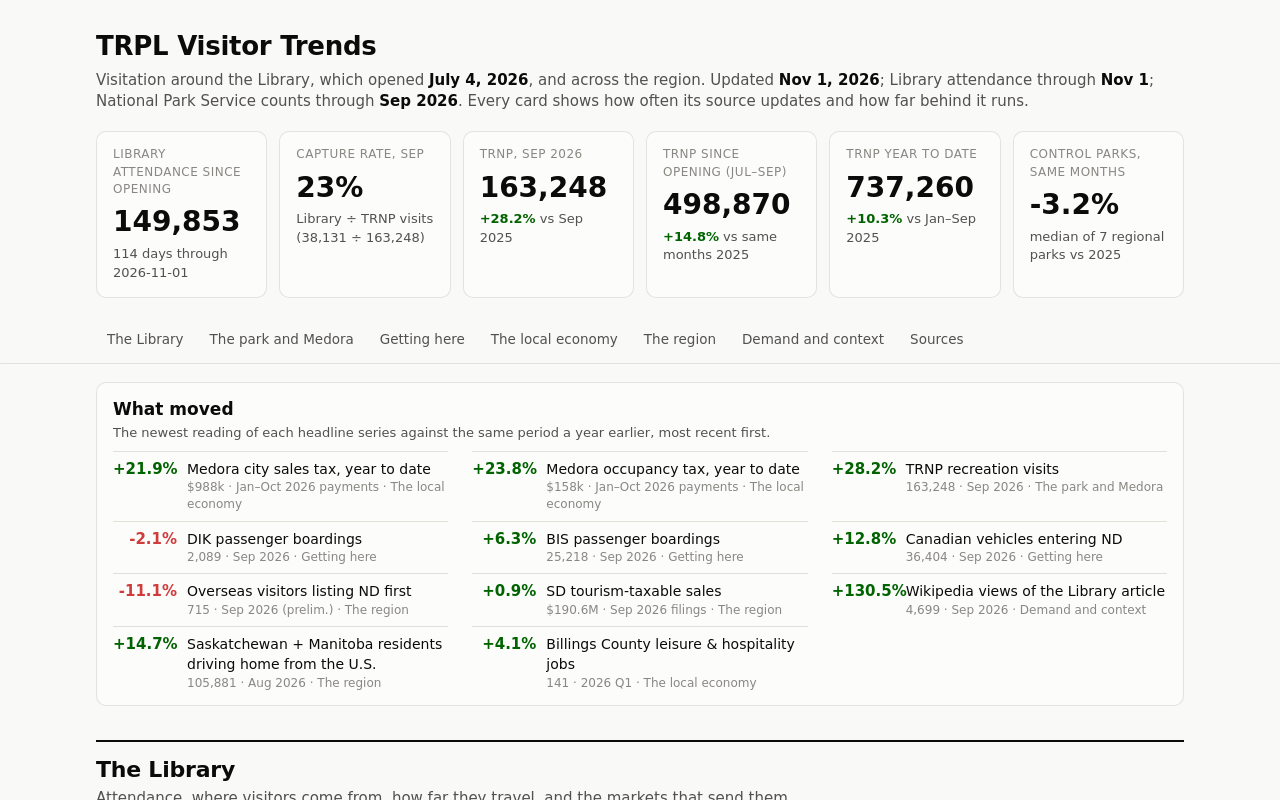
Try it right here
This loads the live project from its own domain, exactly as a visitor would see it.
What it does
A dashboard that gathers the regional signals of visitation around the Library in one place: Library attendance and where ticket buyers come from, monthly visits to Theodore Roosevelt National Park and seven comparison parks, airport boardings, border crossings, interstate traffic counts near Medora, campground reservations, city sales and lodging tax payments, county tourism jobs, and visitor spending estimates.
Each feed has its own small fetcher, so when one public source is down the others still refresh, and a manifest records what was pulled when. Many of these sources were never meant to be scripted — scanned PDFs, rotated tables, WebForms pages, quarterly files of several hundred megabytes — and the repo documents how each one is read. Only aggregates are stored: no customer records, and survey respondent rows are discarded after weighting.
What it can do
- About thirty independent fetchers across federal, state, and park sources
- Daily GitHub Actions refresh that commits changed data and redeploys the page
- Library attendance and visitor origin by state, distance band, and feeder metro
- Control-park comparison that flags and excludes parks with counter outages
- Town-level sales and lodging tax payments, with guidance on reading payment lags
- Aggregates only: ticket counts per ZIP, never customer records
- Every series published as CSV in
data/
Make it your own
Start by forking the repository into your own organization. Everything below assumes you are working in your fork, not this one.
- Fork the repo and edit
config/sources.json: your parks and comparison parks, airports, border ports, traffic counters, counties, and towns. - Run
pip install -r requirements.txt, then the fetchers you need andpython scripts/build.py. Each fetcher stands alone, so drop any that don't apply. - Replace the ticketing fetcher with your own system's, or remove it. Store only counts, never customer records.
- Add the secrets and variables your sources need, such as a ticketing API key and
BLS_CONTACT, an address the BLS will accept in its user agent. - Set Pages to deploy from GitHub Actions and give workflows read and write permission. The first DB1B run downloads about 4 GB; later runs fetch only new quarters.
Stuck on a step? Open an issue on the repository. Questions from people adapting these for their own institution are the most useful feedback we get.