
Try it right here
This loads the live project from its own domain, exactly as a visitor would see it.
What it does
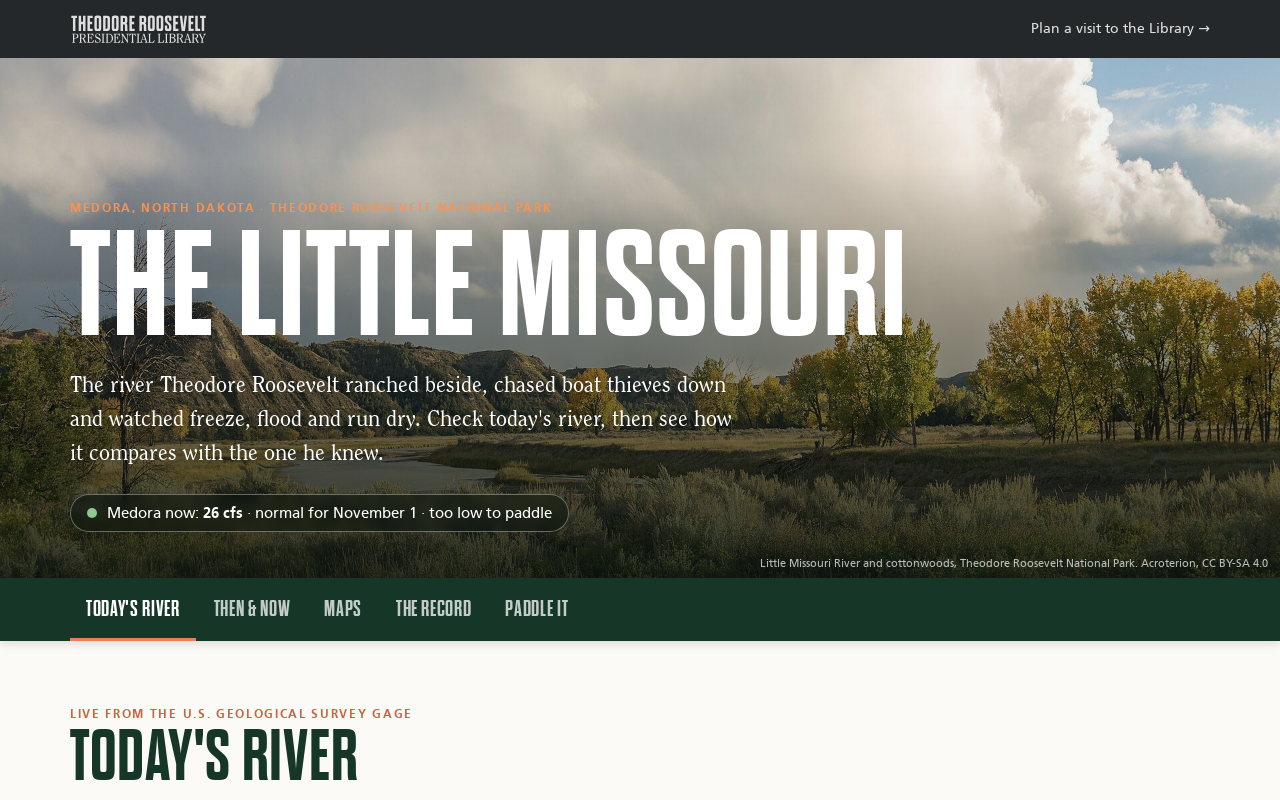
A river page in two halves. Today's River shows live flow and gauge height at Medora against every year on record for the date, paddling status from the park's own thresholds, flood stages, weather, alerts, and a 30-day chart against the normal range. Then & Now sets Roosevelt's own words about the river beside what the gauges have measured since, in eight chapters from 1805 to today.
The Maps section swipes or fades between historic layers — General Land Office survey plats, 1939 and 1957 aerials, 1970s topo — and today's imagery. The Record shows exactly which years exist at each gauge, every yearly peak, and lets a visitor lay any past year over this one. The page is honest that Roosevelt's own years have no measurements.
What it can do
- Live USGS flow with a fallback to the newer Water Data API
- Calendar-day percentiles computed from the full daily record, rebuilt weekly
- Then & Now chapters whose "now" numbers update themselves from the record
- Swipe and fade comparisons with plats, historic aerials, and old topo
- Paddling status from NPS thresholds and NWS flood stages
- Overlay any past year on this one, plus records and yearly peaks
- Self-sizing embeds, including a compact live card for a sidebar
Make it your own
Start by forking the repository into your own organization. Everything below assumes you are working in your fork, not this one.
- Fork the repo and set your USGS gauge ids in
scripts/build_history.pyandassets/app.js, then run it to build the history files. - Replace the chapters in
data/story.json. Keep quotations verbatim and cited. - Render your own historic overlays to
assets/overlays/and updateMAPSITESwith bounds and credits. - Set your paddling thresholds and NWS flood-stage gauges.
- Move
scripts/refresh-history.ymlinto.github/workflows/, give workflows read and write permission, and enable Pages with your ownCNAME.
Stuck on a step? Open an issue on the repository. Questions from people adapting these for their own institution are the most useful feedback we get.